

Quarry Advanced Analysis & Reporting Software is used throughout the wireless product development lifecycle by Antenna Solutions Providers, Chipset Vendors, Brand Owners, ODMs, Test Labs and Carriers.
Analyze
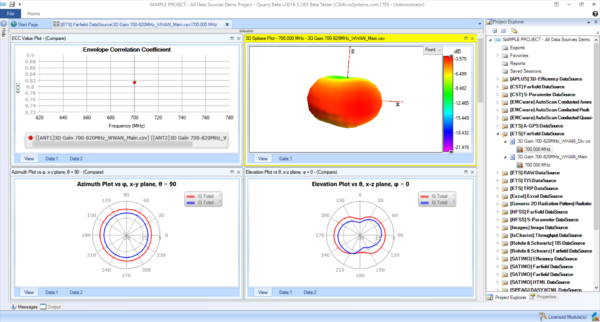
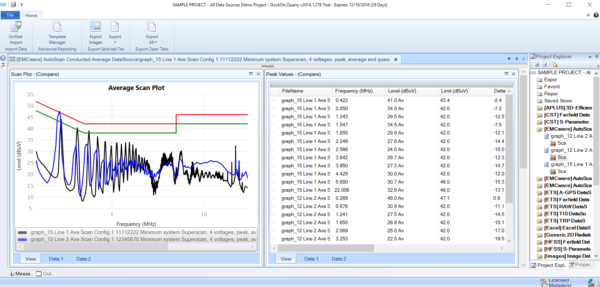
Quarry Analysis is designed for easy comparison of data captured from multiple data sources – simulated and measured – in a single software environment.
- Use simple drag-n-drop to superimpose multiple sets of data for easy comparison in charts/plots/grids
- Customize visualization properties and export into PDF/Word/PowerPoint with a single click
Organize
Quarry’s numerous smart features, data sharing options and session management properties greatly simplify handling of data and development processes across teams, time zones and with clients.
- Auto-save selected data tile exports for easy session restore without recreating report setup
- Enable project collaboration with Quarry Base by configuring Data Stores in: LAN/WAN, Cloud, WebDav, etc
Report
Quarry Tag Builder and Quarry Formula Editor enable identification and manipulation of raw data to automate report generation and create error-free FCC OTA, FCC EMC, SAR, CTIA or any custom report in seconds instead of hours.
- Eliminate human errors typically found in 60% of reports received by TCB’s today
- Take advantage of one of the many standard reports provided or create your own from scratch or from an existing report
Advanced Analysis
Quarry is the only software available today that’s capable of accepting data from different sources such as OTA/EMC/SAR and software simulation tools for easy comparison in the same charts/plots/grids using very simple drag and drop functionality. With Quarry you can import data and analyze and export the results by a single click to generate PDF/PowerPoint/Word/Excel documents.
Superior Reporting
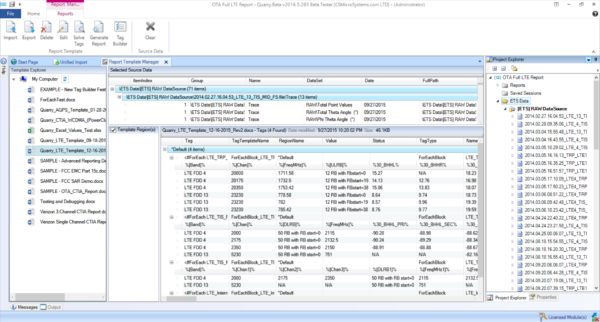
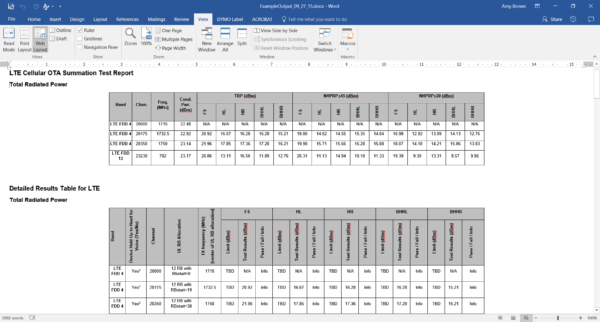
Quarry’s Advanced Reporting feature has a strong tagging system, which allows the user to create report templates. When exporting the data to a specified template, Quarry will identify and manipulate the raw data – be it images, graphs, plots, numbers, etc – and place it accurately inside the report. Using Quarry to automate report generation will save you up to 90% of reporting time and eliminate human errors, which typically is found in 60% of reports received by Telecommunication Certification Bodies (TCBs) today.
Over The Air (OTA)
Quarry has a powerful feature set for Over The Air (OTA) applications in both pre-compliance and full compliance categories. Hundreds, even thousands of OTA measurements from a variety of equipment manufacturers can be seamlessly added to Quarry via the single-step Unified Import feature. Once added to Quarry’s unique data store environment, end users in pre-compliance or product design can analyze the OTA data in Quarry’s fully customizable visualization templates to perform comparisons of i.e. MIMO antenna radiation patterns. Test labs in the full compliance category can also pull together all the data necessary for full compliance reports such as CTIA and FCC reports inside of Quarry and generate these lengthy reports 100% automated, producing a 100% error-free final report in minutes instead of days.
ETS-Lindgren’s EMQuest™
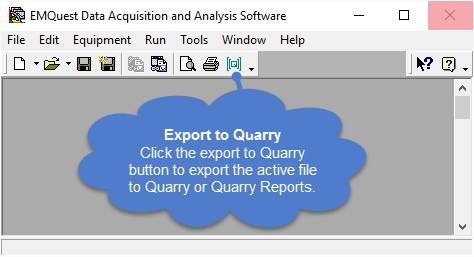
Quarry is now fully integrated with ETS-Lindgren’s CTIA-compliant EMQuest™ Test Executive antenna measurement software providing a single click auto-export of data for further post analysis and reporting. Quarry can automate any standard internal or compliance report (FCC, CTIA, and more), error-free and in a fraction of the time normally spent. A variety of custom report capabilities is available in minutes, instead of hours.
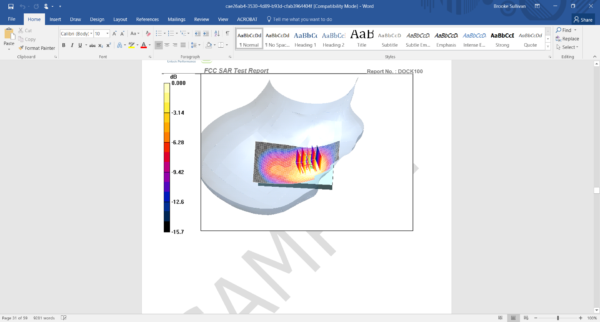
Specific Absorption Rate (SAR)
Professionals in both pre-compliance and full compliance categories doing SAR testing will greatly appreciate the time savings Quarry delivers. After conducting the SAR measurements, operators often dread capturing the data values needed for their reports. This often involves multiple days of copying and pasting numbers, one-at-a-time, from output screens in the SAR testing software into an intermediate data grid such as Microsoft Excel. A modern day LTE cell phone can take up to 25 full days of SAR testing for full compliance and at the end of that marathon, Quarry offers these engineers much welcomed time savings. Quarry can directly import hundreds, even thousands of SAR measurements via the single-step Unified Import feature. Once imported, simply double-click to create a full data grid with all the SAR data values populated. Quarry has just saved multiple days of manual copying/pasting. The grid can be exported to Microsoft Excel for pre-compliance analysis or the Advanced Reporting feature can be utilized to automatically generate a 100% error-free SAR compliance report (such as FCC) in seconds.
Electromagnetic Compatibility (EMC)
Quarry’s Advanced Reporting feature set includes a powerful tagging and formula editor system that allows for a variety of data to be located, extracted, and manipulated before landing in the correct areas within a “Quarry Template” which are Microsoft Word & Excel documents filled with Quarry tags. For EMC professionals, this means you can use your existing report formats and upgrade them into a 100% automated Quarry Template. Once upgraded, the Quarry Templates will generate full compliance reports in a fraction of the time and 100% error free. If there is missing data, Quarry will alert the reviewer to correct them.
Simulation
For RF and antenna designers working with simulation tools, Quarry has an extensive feature set to reduce the time required for analyzing design progress and generating internal/external reports. Essentially, with Quarry, designers can spend much less time generating the plots and figures that they need to communicate to other stakeholders and get back to design optimization. With Quarry’s unique data importing platform, designers can import their simulated data such as antenna radiation patterns and return loss, and compare their results with actual real world measurements done in the OTA chambers. There is no special coding or scripting required, simply drag-n-drop simulated and real world measurements on top of each other to generate the comparison plots.
